

NAACP Report Attacking Oil and Gas Based on Repackaged Anti-Energy Talking Points
The National Association for the Advancement of Colored People (NAACP) and the National Medical Association recently released a joint report with the environmental group Clean Air Task Force (CATF) that purports “for the first time” to demonstrate how air pollution from oil and natural gas facilities disproportionately impacts African American communities.
Although it was promoted as a “new” report, it is actually just the latest iteration of CATF’s thoroughly debunked “Fossil Fumes” and “Gasping for Breath” reports (see previous EID debunks here, here, here, here and here) that have been repackaged numerous times to focus on different segments of the population. The “new” report’s press release plainly acknowledges this fact, stating:
“The health impacts from the oil and natural gas supply chain described in Fumes Across the Fence-Line are based on data and analysis that were first quantified in two recent reports published by CATF. First, Fossil Fumes examined how air toxics are linked to increased risk of cancer and respiratory disorders in dozens of counties that exceed EPA’s level of concern. And Gasping for Breath, also published in 2016, estimated the health impacts from ozone smog caused by emissions from the oil and gas industry.”
Not surprisingly, the data used to support the NAACP’s claims about cancer and asthma in African American communities are deeply flawed. Along with the willful omission of air quality improvements attributable to increased natural gas use and the oil and gas industry’s undeniable contribution to economic growth, the report is exposed for what it really is — an advocacy piece, rather than anything approaching a scientific paper.
Here’s what you need to know about the latest regurgitation of these CATF reports.
#1. Gets the facts wrong on ground level ozone
Using the same data and modeling from “Gasping for Breath,” the NAACP report claims,
“The oil and natural gas industries violate the Environmental Protection Agency’s (EPA) air quality standards for ozone smog due to natural gas emissions in many African American communities, causing over 138,000 asthma attacks among school children and over 100,000 missed school days each year.”
Not only is the modeling used to arrive at the latter figure deeply flawed, the premise that oil and natural gas development is solely responsible for ground level ozone is without merit.
It is worth noting that “Gasping for Breath” — which, again, this new NAACP report is based off of — was directly debunked by the Texas Commission on Environmental Quality (TCEQ) for suggesting emissions from oil and gas development caused local air pollution, and in turn caused spikes in asthma attacks.
As the Fort Worth Star-Telegram reported last year:
“State regulators say emissions from oil and gas operations are not a major contributor to air pollution in the Dallas-Fort Worth area, calling into question a recent environmental report linking methane leaks to an anticipated rise in asthma attacks…
“Texas Commission on Environmental Quality data shows that operations associated with the energy industry in Fort Worth and Dallas contribute 1.8 parts per billion to ozone levels on the worst days, from May to September, while planes, trains and automobiles contribute 14.1 parts per billion. Those measurements also were taken during the peak times of the ozone season, agency officials said.” (Emphasis added)
The Star-Telegram also reported that TCEQ officials criticized CATF for using emission estimates and computer models that assume all emissions are from oil and gas production, rather than direct measurements, in its report:
“David Brymer, the agency’s director of air quality, voiced doubts about how Earthworks and the Clean Air Task Force used its computer models to produce the information and then how they analyzed that data. Brymer cautioned that they have insufficient information to entirely evaluate the environmental report.”
Speaking of those models, CATF arrived at its estimate for lost school days from asthma attacks by using EPA’s BenMAP software program, which bases its estimates for a number of endpoints and effects on subjectively peer-reviewed studies on those selected topics. The modeling — which projects ozone levels for 2025 — is also based on EPA National Emissions Inventory (NEI) data from 2011. In other words, the report bases its argument on an inventory that is five years old, even though technologies and the regulatory environment have changed dramatically during that period of time.
CATF’s methodology for attributing ozone to the natural gas sector is equally shaky. The report states,
“Using the same studies and methodology as the EPA used in its recent Ozone National Ambient Air Quality Standards (NAAQS) rule making process, CATF’s ozone modeling estimates the impact on public health the can be directly attributable to ozone caused by emissions from the natural gas sector.”
But the studies used in the NAAQS rule do not address source attribution. Therefore, CATF relied exclusively on its own modeling, assumptions and extrapolations to arrive at its conclusions on source attribution. Because of this lack of quality raw data and untested assumptions, the CATF’s conclusions are highly uncertain at best.
If anything, the most recent EPA data indicate that increased natural gas use has reduced ozone. Emissions of nitrogen oxide (NOx) — the most significant precursor to ozone formation — are down 49 percent since 2005, thanks in large part to increased natural gas use for electricity generation. Volatile organic compound emissions, which combine with NOx to form ozone, are down 16 percent since 2005. Not coincidentally, asthma rates and hospitalizations across the U.S. have also declined as natural gas production has ramped up.
The fact that oil and natural gas production has increased 81 percent and 47 percent, respectively, since 2005 at the same time that ozone precursors have declined can be traced to the fact that tailpipe emissions — not oil and gas development — are responsible for a vast majority of ground level ozone formation.
#2. Gets the facts wrong on cancer risk
The report flatly claims that oil and gas facilities are increasing cancer risk in African American communities,
“Many African American communities face an elevated risk of cancer due to air toxics emissions from natural gas development…”
“Over 1 million, or two percent of African Americans, live in areas where toxic air pollution from natural gas facilities is so high that the cancer risk due to this industry alone exceeds EPA’s level of concern.”
Again, this conclusion is based entirely on the findings of the aforementioned “Fossil Fumes” report. And notably, even CATF has even admitted “Fossil Fumes” had “data quality issues” and is “not a measure of actual risk” stemming from the fact that it inappropriately misused data from from EPA’s National Air Toxics Assessment (NATA) and National Emissions Inventory (NEI) to deceptively map places that exceed EPA’s “level of concern” for increased cancer risk.
Importantly, “Fossil Fumes” doesn’t consider that there are other contributing factors to the emissions levels and treats regions with oil and gas facilities as if those oil and gas facilities are the sole emitters in the area. A prime example of this flawed assumption is the fact that, according to NATA data, Tarrant Country, Texas — which is located at the heart of the Barnett Shale — actually has less than two-thirds the total cancer risk of Polk County, Iowa, which has no oil and natural gas production and isn’t even mentioned in this report.
CATF has acknowledged limitations of the data, stating: “The EPA developed NATA to inform nation and local data collection and policy efforts. However, the agency emphasizes that because of data quality issues and uncertainties in the model, the data should be used cautiously.”
CATF also admits the data is not a measure of actual risk, saying, “[NATA] should be used to screen for geographic areas with high risk, not a measure of actual risk in specific locations.” In other words, “Fossil Fumes” identifies hazards — the mere presence of chemicals that be may harmful — without adding context on dose and exposure, which must be considered to determine risk level. And in fact, ambient concentrations of air pollutants referenced in the report are well below the reference concentrations EPA considers to be levels of potential concern.
Most notably, concentrations of benzene cited in the report are all well below the EPA benzene reference concentration (RfC) of 30 µg/m3, which is in line with recent studies based on actual oil and gas facility air measurements.
The Colorado Department of Public Health and Environment recently evaluated 10,000 air samples from parts of the state with “substantial” oil and gas operations and found:
“All four cancer-causing substances (benzene, ethylbenzene, formaldehyde and acetaldehyde) were within acceptable risk range, even for combined exposures.”
A peer-reviewed 2016 University of Texas at Arlington study based on 12,800 mobile mass spectrometry measurements across 13 Eagle Ford Shale counties found BTEX readings — including benzene — found emissions were well below federal safety thresholds.
And a peer-reviewed 2015 Drexel study based on measurements at Marcellus well sites states, “We did not observe elevated levels of any of the light aromatic compounds (benzene, toluene, etc.).”
Additionally, according to data from EPA’s 2008 and 2015 Reports on the Environment, ambient benzene concentrations fell by 71 percent from 1994 to 2013 nationwide – largely due to reductions in refinery emissions and improvements in gasoline.
CATF conveniently ignore the facts on overall benzene levels and benzene emissions from oil and gas facilities. But that isn’t the only data it chooses to ignore.
#3. Fails to acknowledge oil and gas industry’s contribution to improved air quality and economic growth
The report not only claims “heavy polluting” from oil and natural gas facilities are adversely effecting African American communities, but even claims that the industry hurts the African American community by providing dangerous jobs with poor salaries.
“Communities impacted by oil and gas facility operations remain affected due to energy companies’ heavy polluting, low wages for dangerous work, and government lobbying against local interests.”
These claims couldn’t be further from the truth.
Not only does the oil and natural gas industry support 10.3 million jobs across the country, industry occupations typically pay twice the median U.S. salary. Furthermore, a 2016 IHS report projects the oil, natural gas and petrochemical industries will provide an additional 1.9 million job opportunities through 2035, including many opportunities for minorities:
“[The number of minorities in oil and gas] will [continue to] rise from about a quarter of the total to 86% by 2035. African American and Hispanics are expected to make up over 25% of the hires in industry management, financial and business jobs during this time.” [emphasis added]
The oil and natural gas industry provides better employment opportunities than what many Americans can typically find, and it’s lowering energy costs as well. In fact, a recent report from the Business Council for Sustainable Energy and Bloomberg New Energy finds American consumers are now spending less of their incomes on energy than ever before in the modern era.
This is significant, considering a co-author of this NAACP report, Marcus Franklin, authored another NAACP report in March that argued low-income/African-American communities are more affected by higher energy costs. The report states,
“African Americans spend a significantly higher amount of their total incomes on energy—including electricity, heating, fuel, and the energy used to produce, package, transport and sell goods…”
Experts also agree that increased natural gas use over the past decade has led to dramatic declines in air pollution on a national scale that also have undeniable positive impacts on public health.
Natural gas not only emits far less carbon dioxide than other fossil fuels when burned, but it also emits far fewer criteria pollutants such as nitrogen dioxide, sulfur dioxide and particulate matter. This is why experts agree increased natural gas use in recent years has led to the dramatic declines detailed in the following EID chart.
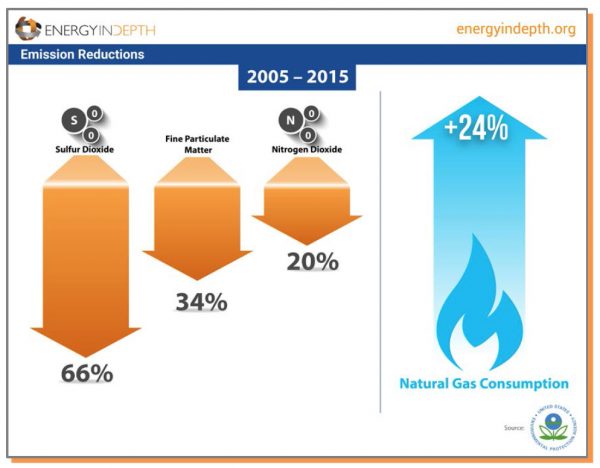
As natural gas consumption has increased 24 percent since the start of the shale boom, EPA data show emissions of the most dangerous “criteria pollutants” — sulfur dioxide, nitrogen dioxide and fine particulate matter (PM2.5) — have decreased dramatically.
EPA has previously noted that sulfur dioxide is of “greatest concern,” primarily because it can lead to PM2.5 formation. Fracking’s role in reducing PM2.5 pollution has even prompted University of California-Berkeley professor Richard Muller to say:
“For shale gas is a wonderful gift that has arrived just in time. It can not only reduce greenhouse gas emissions, but also reduce a deadly pollution known as PM2.5 that is currently killing over three million people each year, primarily in the developing world.”
Conclusion
Though completely unfounded, this report’s inflammatory claim of “systemic oppression perpetuated by the traditional energy industry” is not all that surprising considering CATFhas received hundreds of thousands of dollars from the Energy Foundation, a prominent anti-fossil fuel organization that has poured millions into anti-fracking causes. But even we were amazed at how egregious the language is in this advocacy document.
Like the CATF reports that preceded it, this report is just another repackaged set of talking points designed to sow public doubt about fossil fuel development. But no matter how many times it gets recycled, its data flaws and omissions render it invalid.
